
Wazuh Already Ships OpenSearch — Stop Installing a Separate One
Wazuh ships with OpenSearch built in. This post shows how we used that to collect CPU/memory/disk metrics, netstat output, login history, and nginx logs from every agent — all flowing into the same indexer, with custom decoders and alert rules on the manager side.
You Already Have OpenSearch
If you're running Wazuh, you already have OpenSearch. It ships with it.
The Wazuh indexer — the component that stores and indexes every alert, log, and event your agents produce — is OpenSearch under the hood. It's not a separate product you bolt on afterward. It's not a companion service you need to provision. It's already there, running, indexed, and queryable the moment you install the Wazuh manager.
This matters because a common pattern in infrastructure setups is to install Wazuh for security monitoring and then separately reach for OpenSearch (or Elasticsearch) for log aggregation and search. That's two clusters, two sets of resource allocations, two things to keep upgraded and in sync. If you're already running Wazuh with any reasonable volume of agents, you have a capable, production-grade OpenSearch cluster sitting idle for everything except security events.
This post documents how we extended our Wazuh setup to collect richer operational data from agents — not just security events, but system resource usage, active network connections, recent logins, and web server access logs — all flowing into the same indexer, searchable from the same Wazuh dashboard.
Installing the Agent (RHEL / CentOS / Fedora)
Start by adding the Wazuh repository and installing the agent package:
rpm --import https://packages.wazuh.com/key/GPG-KEY-WAZUH

cat > /etc/yum.repos.d/wazuh.repo << EOF
[wazuh]
gpgcheck=1
gpgkey=https://packages.wazuh.com/key/GPG-KEY-WAZUH
enabled=1
name=EL-\$releasever - Wazuh
baseurl=https://packages.wazuh.com/4.x/yum/
priority=1
EOF

dnf install -y wazuh-agent
Enable and configure the agent to point at your manager:
systemctl daemon-reload
systemctl enable wazuh-agent

sed -i 's/MANAGER_IP/wazuh.raspiska.local/g' /var/ossec/etc/ossec.conf
The sed command replaces the placeholder MANAGER_IP in the default ossec.conf with your actual manager hostname or IP. After that, start the agent and verify it shows up connected in the Wazuh dashboard.
What to Collect from Each Agent
The default Wazuh agent configuration covers file integrity, vulnerability detection, and system auditing. That's solid. But with localfile blocks, you can push almost anything — command output, application logs, structured data — into the indexer without writing a single line of custom code.
Network ports and active listeners
Knowing which ports are listening on each machine at any given time is foundational. This block runs netstat every 6 minutes, parses the output into a readable format, and ships it as a structured log:
<ossec_config>
  <localfile>
    <log_format>full_command</log_format>
    <command>netstat -tulpn | sed 's/\([[:alnum:]]\+\)\ \+[[:digit:]]\+\ \+[[:digit:]]\+\ \+\(.*\):\([[:digit:]]*\)\ \+\([0-9\.\:\*]\+\).\+\ \([[:digit:]]*\/[[:alnum:]\-]*\).*/\1 \2 == \3 == \4 \5/' | sort -k 4 -g | sed 's/ == \(.*\) ==/:\1/' | sed 1,2d</command>
    <alias>netstat listening ports</alias>
    <frequency>360</frequency>
  </localfile>
</ossec_config>
The alias field is important — it's what Wazuh uses to identify this command's output in rules and decoders, so keep it consistent.
Recent logins
<ossec_config>
  <localfile>
    <log_format>full_command</log_format>
    <command>last -n 20</command>
    <frequency>360</frequency>
  </localfile>

  <logging>
    <log_format>plain</log_format>
  </logging>
</ossec_config>
last -n 20 gives you the 20 most recent login records. Running it every 6 minutes means you'll catch any new login within a reasonable window without hammering the system.
CPU, memory, disk, and load
This is the most useful one. A single echo command with inline awk, free, df, and /proc/loadavg reads produces a compact, pipe-delimited status line that's easy to decode:
<ossec_config>
  <localfile>
    <log_format>command</log_format>
    <command>echo "CPU:$(top -bn1 | grep -o 'Cpu.*' | awk '{print $2+$4+$6+$12+$14+$16}')|MEM:$(free -m | awk 'NR==2{printf "%.1f", $3*100/$2}')|DISK:$(df -h / | awk 'NR==2{print $5}' | tr -d '%')|LOAD1:$(awk '{print $1}' /proc/loadavg)|LOAD5:$(awk '{print $2}' /proc/loadavg)"</command>
    <alias>system_resource_usage</alias>
    <frequency>60</frequency>
  </localfile>
</ossec_config>
This runs every 60 seconds. The output looks like:
CPU:12.4|MEM:67.2|DISK:43|LOAD1:0.85|LOAD5:0.72
One line, five fields, everything the manager needs to trigger alerts or feed a dashboard panel.
Web server logs (nginx)
If the machine runs nginx, forward its access and error logs with the built-in Apache decoder (nginx's log format is compatible):
<ossec_config>
  <localfile>
    <log_format>apache</log_format>
    <location>/var/log/nginx/*access.log</location>
  </localfile>

  <localfile>
    <log_format>apache</log_format>
    <location>/var/log/nginx/*error.log</location>
  </localfile>
</ossec_config>
The wildcard in location picks up multiple vhost log files automatically. Wazuh ships with nginx/Apache decoders and rules out of the box, so HTTP 4xx/5xx spikes, scan patterns, and authentication errors start alerting immediately without any custom rules.
Decoding the Resource Data (Wazuh Manager)
The resource monitor command produces structured output, but Wazuh needs a decoder to extract the individual fields so rules can match against them. Add this to /var/ossec/etc/decoders/0001-local-decoder.xml on the manager:
<decoder name="resource-monitor">
  <program_name>^resource_monitor$</program_name>
</decoder>

<decoder name="resource-monitor-fields">
  <parent>resource-monitor</parent>
  <regex type="pcre2">CPU:(\d+\.?\d*)\|MEM:(\d+\.?\d*)\|DISK:(\d+)\|LOAD1:(\d+\.?\d*)\|LOAD5:(\d+\.?\d*)</regex>
  <order>cpu,mem,disk,load1,load5</order>
</decoder>
The parent decoder matches the program name, and the child decoder uses a PCRE2 regex to extract all five fields by name. Once decoded, cpu, mem, disk, load1, and load5 become first-class fields in the alert — you can filter on them in the dashboard, reference them in rule descriptions, and build visualizations on top of them.
Alert Rules (Wazuh Manager)
With the decoder in place, add threshold rules to /var/ossec/etc/rules/local_rules.xml:
<group name="system_resource,resource_monitoring">

  <!-- Base rule: identifies any system_resource_usage event -->
  <rule id="100002" level="0">
    <if_sid>5715</if_sid>
    <field name="alias">^system_resource_usage$</field>
    <description>System resource usage monitoring</description>
  </rule>

  <!-- High CPU (85%+) -->
  <rule id="100003" level="7">
    <if_sid>100002</if_sid>
    <match>CPU:8[5-9]|CPU:9[0-9]|CPU:100</match>
    <description>High CPU usage detected: $(full_log)</description>
    <group>high_cpu</group>
  </rule>

  <!-- Critical CPU (95%+) -->
  <rule id="100004" level="10">
    <if_sid>100002</if_sid>
    <match>CPU:9[5-9]|CPU:100</match>
    <description>CRITICAL: Very high CPU usage detected</description>
    <group>high_cpu</group>
  </rule>

  <!-- High Memory (90%+) -->
  <rule id="100005" level="7">
    <if_sid>100002</if_sid>
    <match>MEM:9[0-9]|MEM:100</match>
    <description>High Memory usage detected</description>
    <group>high_memory</group>
  </rule>

  <!-- Critical Memory (95%+) -->
  <rule id="100006" level="10">
    <if_sid>100002</if_sid>
    <match>MEM:9[5-9]|MEM:100</match>
    <description>CRITICAL: Very high Memory usage detected</description>
    <group>high_memory</group>
  </rule>

</group>
A few things worth noting here:
if_sid: 5715— This is the Wazuh SID for command output events. The base rule (100002) anchors everything to events from our specificsystem_resource_usagealias, so these rules don't accidentally fire on other command outputs.- Rule chaining — 100003/100004 and 100005/100006 are tiered: level 7 for high, level 10 for critical. In practice this means a sustained 90% CPU gets a warning; 96% gets a page.
- Regex matching — The
<match>patterns use character ranges to avoid false positives from partial number strings.CPU:8[5-9]matches 85–89 only;CPU:9[0-9]catches 90–99. Level 10 overlaps intentionally — a 97% event will match both the level 7 and level 10 rules, and Wazuh fires the highest-level match.
After adding the decoder and rules, reload them without restarting the manager:
/var/ossec/bin/wazuh-logtest    # test the decoder interactively
systemctl restart wazuh-manager  # or use the API
What You Get at the End
Once agents are reporting and the rules are loaded, the Wazuh dashboard gives you:
- Per-agent resource history — CPU, memory, disk, and load over time, filterable by host
- Real-time alerts — any agent crossing the CPU or memory thresholds generates a Wazuh alert immediately, which you can route to Slack, PagerDuty, or email via Wazuh's notification integrations
- Port inventory — a rolling record of what was listening on each machine every 6 minutes, useful for detecting unexpected services or lateral movement
- Login history — recent
lastoutput indexed and searchable across the fleet - Web traffic — nginx access and error logs from every agent, with Wazuh's built-in HTTP rules already active
All of it lands in the same OpenSearch cluster that was already running the moment you installed Wazuh. No second cluster, no index synchronization, no extra TLS certificates to manage. The data is already there — it just needed the agent configuration to start flowing.
Running Wazuh at Raspiska across our internal infrastructure. Questions or suggestions are welcome via GitHub.
Technologies Used
Other
Related Projects
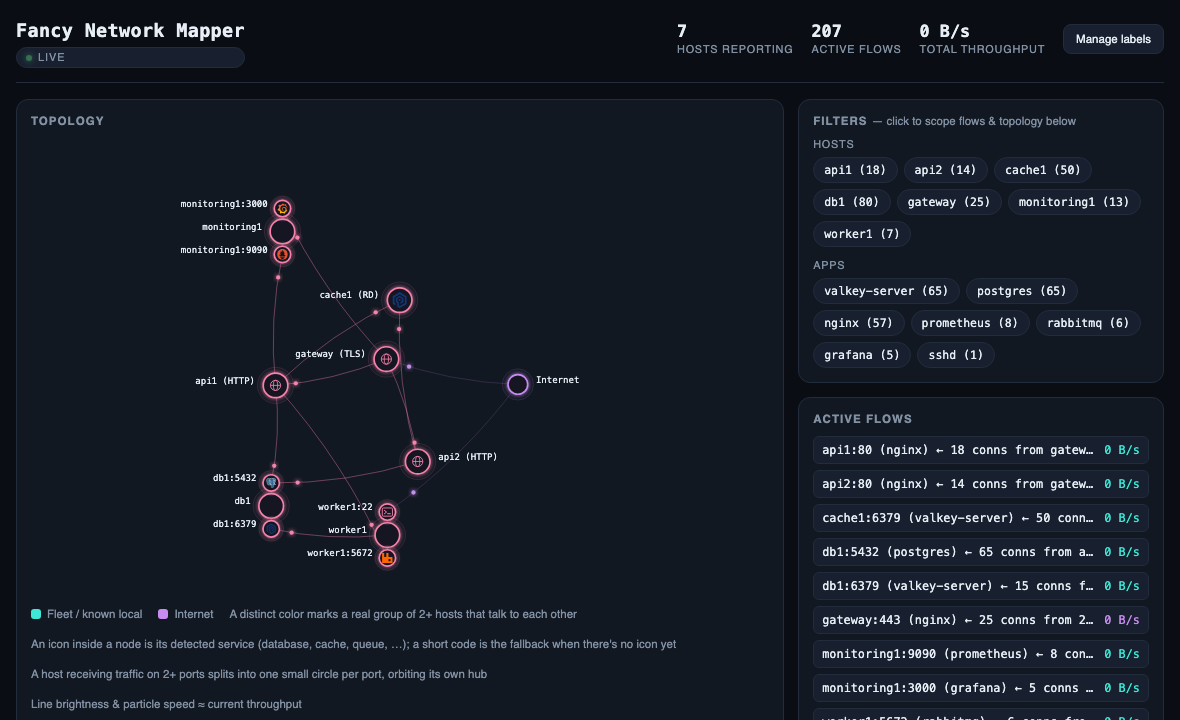
Fancy Network Mapper
I got tired of not knowing what my servers were talking to, so I built a tiny network mapper — two Go binaries that read the kernel's conntrack table and draw a live, force-directed map of who talks to whom across a fleet, with real throughput.
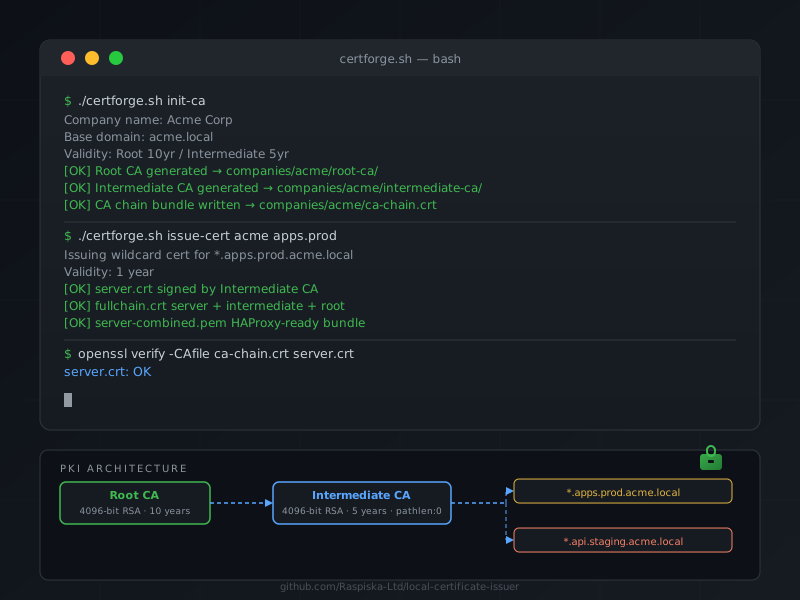
CertForge
A single Bash script that sets up a two-tier private CA (Root + Intermediate) and issues wildcard SSL/TLS certificates for internal services — no daemon, no dependencies, just OpenSSL.
Have a project in mind?
Let's work together to bring your ideas to life. Our team of experts is ready to help you build something amazing.